Measuring the World with Cricket Measuring the World with Cricket
One tool that I have used at a number of sites, and have been more than happy with is Cricket. It is far superior to the more common MRTG in a number of ways (more configurable, able to take more than two inputs, able to handle non-integers, only creates graphs when viewed, and more).
Configuration is done in a hierarchy of files and directories, with the web interface following that hierarchy.
Graphs, by default, show high details (depending on your sampling time) for almost 48 hours, then a lower detailed graph (averaged from the previous graph) for 10 days. Other graphs show six weeks worth of data, and finally, fifteen months of data.
SNMP OIDs (see Glossary) can be monitored by default, and it is simple to extend the sampling as any external scripts that return numbers can be plotted.
Cricket measures, it doesn't monitor. It doesn't generate alerts when numbers go outside ranges, handle escallations, do service dependencies or anything like that. You want another tool, such as netsaint for that. To be honest, cricket can do monitoring, but it is really, really bad at it. Use netsaint.
|
The cricket configuration is in a tree, which gets compiled into a database
for quick access. Everything within the config tree is used, independent of
the filename. This has its advantages and disadvantages. Primary umongst
the disadvantages is that you can't use RCS on your configuration, as it
will treat the RCS file as just more config files. You can also have multiple configuration files at any level. So if you are trialling a new source of data you can put all the relevent details in different files, so that it doesn't affect the existing configuration, and is trivial to back out if needed. Configuration information is inherited, so using the example structure on the right, when looking at Server1 it takes its configuration from the aggregate of:
The datafiles, by default, are placed in a mirror hierarchy, with cricket-data instead of cricket-config as the head directory. These are created automatically by cricket the first time that data is attempted to be placed in them. Configuration generally consists of defining the following:
|
|
As well as the server and router specific directories, I generally have directories for the applications. So for web servers there will be the details relevent to web servers, but instead of just replicating the relevent details from the server, you can aggregate them on the same graph using something called mtargets (described later). This makes it easier to do comparisons. Any other measurements that are specific to the collection of web servers can also be placed here.
This makes it very easy to determine problems with applications, as there is a place to go to see all the members of that application set together rather than having to switch between six different screens and trying to rescale in your head. As each server can host multiple applications it also means that you can display the same information in multiple relevent places without the overhead of gathering the same data multiple times.
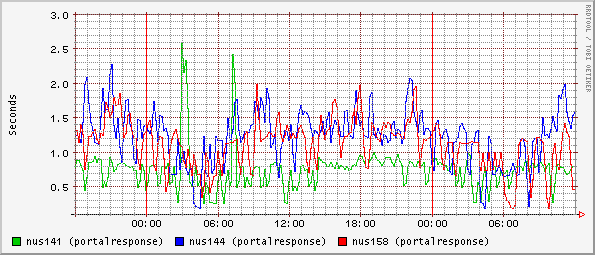 |
| Figure 2: Example mtargets output |
For example, a target type that plots load average could be defined as:
targetType load_stats
    ds = "load_1, load_5, load_15"
    view = "Load: load_1 load_5 load_15,
	    Load15: load_15"
This means that a target type called load_stats consists of three
datasources (defined below), called load_1, load_5 and
load_15. There are two different views of this data; one labelled
Load which shows the data from all three, and another labelled
Load15 which just shows the load_15 data. See Figure 3
for how different views and presented to the user.
dataSource load_1
        ds-source = exec:0:"/home/cricket/bin/crickget %host% load"
	rrd-ds-type = GAUGE
This means that for the datasource load_1 the collection
method is to run the script named with the arguments %host% (a
variable, explained later), and load. The load_5 and
load_15 mentioned in the previous targetType have to be
defined seperately.The rrd-ds-type gets passed to the rrd database that stores the data collected by cricket. The two main types are GAUGE and COUNTER.
There are two ways of dealing with this: You can go in and edit the data values. This is tedious and time consuming, and will only fix it once, or alternatively you can specify a maximum value that rrd will accept. Pick something that isn't going to restrict or mimic the normal behaviour of the device; something twice its maximum capability should be reasonable. That way your graphs, while they still have a spike in them, are still perfectly useable for the rest of the time.
You can set other rrd flags, such as minimum and maximum data values acceptable and the maximum time between samples before it is marked as unknown.
graph load_1
    legend = "One Minute Load Average"
    y-axis = "LoadAv"
    units = "load"
Generally you don't want to specify colours as this can lead to
problems when you combine graphs. For example, if you specify that all
the load averages should be plotted in green, when you plot all
the load averages together you would get three green lines with no
indication of which is which.
To follow our previous example:
target load
	short-desc = "Load Average Stats"
	target-type = load_stats
	host = www.foo.com
This says to run the target type load_stats (specified above) using www.foo.com as the value of %host%, and place the resulting data into the database called load. The "Load Average Stats" is used in the description field. An example of the resulting graph is shown in Figure 4 much later in this paper.
The target name, load in this case, is used as the base for the datafile, so if the above target statement was in cricket-config/site1/servers/foo/Target, then the datafile created would be cricket-data/site1/servers/foo/load.rrd. The reason that it doesn't call it load_stats.rrd or target.rrd or anything else, is that you generally have multiple databases per host being measured, and they all need distinct names.
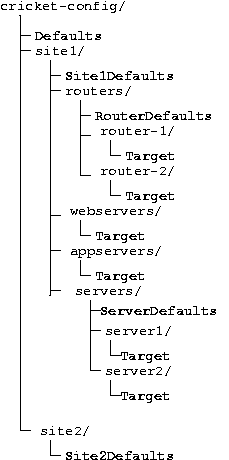
For example:
target = web_response
    short-desc = "Response stats for web servers"
    mtargets =
        "/easyisp/servers/nus141/portalresponse;
        /easyisp/servers/nus144/portalresponse;
        /easyisp/servers/nus158/portalresponse"
    target-type = portal
    targets-short-desc = "( 'nus141', 'nus144', 'nus158' )"
This says that for to collect the portal responses of three servers
('nus141', 'nus144' and 'nus158') and graph them together. The names
are the names of the rrd datafiles under cricket-data, with
everything converted to lower-case. The target-type is
important (and missing from the cricket documentation) and tells
Cricket how to describe the data.
Enough configuration can be done, changing things to corporate standards, that you can put your cricket graphs in customer viewable areas, and not annoy those in marketing too much.
The web interface follows the directory structure of the configuration area. For example, see Figure 1. The path to details about server1 are in /site1/servers/server1. When there you would see all the targets for that server, and the various views.
| ||||||||||||
| Figure 3: Example directory view |
Hourly Graph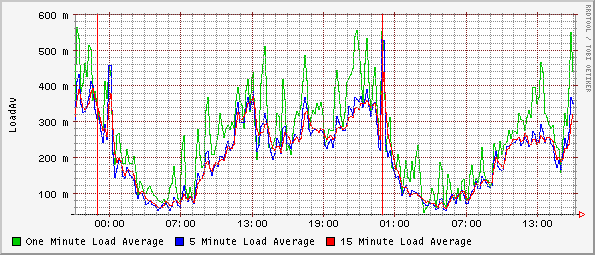
| |||||
| Figure 4: Example graph view |
For example, to measure the number of octets going out of an interface, see the example in Figure 5. This could all be in one file, but far more likely, and more usefully, the top stuff would be in a default file, and each server would have its own Target section.
Target --default--
    snmp-community   = secret
    snmp-port        = 161
    snmp             = %snmp-community%@%snmp-host%:%snmp-port%

OID     ifOutOctets             1.3.6.1.2.1.2.2.1.16

dataSource  ifOutOctets
    ds-source               =   snmp://%snmp%/ifOutOctets.%inst%
    bytes                   = true

graph   ifOutOctets
    color       =   blue
    legend      =   "Average bits out"
    y-axis      =   "bits per second"
    units       =   "bits/sec"
    scale       =   8,*
    bytes       =   true

targetType out_traffic
    ds = "ifOutOctets"
    view = "OutTraffic: ifOutOctets"

Target out_traffic_iprb0
    target-type = out_traffic
    snmp-host = www.foo.com
    inst = 2
    short-desc = "Out Traffic on iprb0 interface"
|
| Figure 5: Example SNMP poll |
The inst = 2 in the Target definition simply means the second instance in the ifOutOctets table. If your target has multiple interfaces, then each can be accessed individually. This instance number gets appended to the OID as shown in the dataSource statement. To find out which instance to use, you can use snmpwalk on the target device.
As to the magic 1.3.6.1.2.1.2.2.1.16 number, see a good reference on SNMP as to where it, and many others like it, came from. As well as the standard MIB (Management Information Base - or set of numbers) which most servers use, SNMP has been extended by various vendors to provide specific data on their machines. They then publish a SNMP-MIB (sometimes publish is too strong a word, hide would be more appropriate in some circumstances) which describes these extensions. Reading through these MIBs can reveal all sorts of interesting information that you can measure that you didn't know was possible, such as temperature of various sensors, power supply outputs, and others.
The scale = 8,* is there to convert the octets returned by snmp into bits so that it can be graphed in the standard units. The scale uses a simple stack based maths system. The bytes = true simply means that it scaled by powers of 2, rather than the default powers of 10.
For example:
dataSource load_1
        ds-source = exec:0:"/home/cricket/bin/crickget %host% load"
	rrd-ds-type = GAUGE
the ds-source statement says to run
/home/cricket/bin/crickget with arguments load and
whatever gets expanded from %host%. The 0 says take
the number from the first line of the result. If you want the answers
from multiple lines you will have to run the script multiple times,
giving a different line number each time. Cricket only reads the number
part of the line; anything after the number is ignored and can be used
for comments. For example the remote monitoring daemon details below
returns
0.06 Load Av 1min
0.05 Load Av 5min
0.06 Load Av 15min
which makes it easy to debug, and also means that a simple telnet session can be used to grab human readable information.
The script is also trivial to extend to add more functionality as needed. In this way a large variety of information can be gathered about the remote host, without a large programming effort, and a multitude of scripts.
A little cacheing at the Cricket end ensures that the measuring doesn't have a serious impact on the host being sampled. Also as Cricket only understands one number at a time, you have to run the sampler many times to return different aspects of the same information. For example, getting details about a CPU returns five different numbers (usr%, sys%, wt%, idle% and busy%). Instead of asking the system being measured for the CPU stats five times (and getting potentially inconsistent answers), the remote system is polled once, and all the results are stored in a cache on the Cricket host. Future queries for the other details are satisfied out of the cache.
The preferred method is to collect your targets into subtrees, and then run
another command to collect everything in that subtree. So, for example:
% collect-subtrees site1
The site1 is taken from a config file subtree-sets which
looks like:
set site1:
	/site1
set site2:
	/site2
collect-subtrees is designed to be used by cron. It runs the collector program and sends the output to a logfile, and only generates output if there is an error. It also has locks to prevent it running multiple times at once.
I generally set cricket up so that everything is monitored every ten
minutes. I split the configuration up into a number of approximately
equal chunks, and then set cron up to spread the load, something like:
1,11,21,31,41,51 * * * * collect-subtrees chunk1
3,13,23,33,43,53 * * * * collect-subtrees chunk2
5,15,25,35,45,55 * * * * collect-subtrees chunk3
7,17,27,37,47,57 * * * * collect-subtrees chunk4
9,19,29,39,49,59 * * * * collect-subtrees chunk5
This means that the cricket monitoring host shouldn't be under severe load at any one time. It also means that if for some reason collecting from a host takes a long time (the host has hung for example, and things need to timeout), then other subtrees will still continue collecting.
You can't measure things retro-actively, so it is far better to measure too much than too little. However measuring everything takes lots of time, space and cpu.
Measure things that matter. If your business depends on serving web pages, measure the web server response times, number of web servers running, number of hits and so forth. If you don't care about the web server, then its probably a waste of time to measure it.
Measure all steps in a process, not just end to end. If you provide web services through web services, back end services, and a database, then measure not just how long it takes to retrieve a full page, but also measure how long it takes to get a static page from the web servers, how long the back end takes to respond (even a null request), how long the database takes to respond, and even the average response time of the disks that the database is stored on. Also measure the network traffic on each interface on each of the boxes, and any approprite routers. This way, if the users start complaining of slow response times, you can narrow the problem down, rather than just agreeing that yes it has slowed down 43% since last week.
Cricket is my graphing tool of choice - while it takes a bit to set up it is low impact, and can be very powerful.
From the website:
RRD is the Acronym for Round Robin Database. RRD is a system to store
and display time-series data (i.e. network bandwidth, machine-room
temperature, server load average). It stores the data in a very compact
way that will not expand over time, and it presents useful graphs by
processing the data to enforce a certain data density. It can be used
either via simple wrapper scripts (from shell or Perl) or via frontends
that poll network devices and put a friendly user interface on it.